Giriş
Açıklaması şöyle. Yani Full GC başlayınca artık paralel olarak yapılıyor.


Serial GC was the first garbage collector introduced in HotSpot in 1999 as part of Java Development Kit (JDK) 1.3.1. The Parallel and Concurrent Mark Sweep collectors were introduced in 2002 as part of JDK 1.4.2.
Ne Zaman Kullanılır
The G1 Garbage Collector is a heavy duty GC designed for big workloads on machines with large heap sizes (roughly 6GB or higher). It tries to adapt to the working conditions in the given machine. You can explicitly enable it using the JVM option -XX:+UseG1GC.G1 is a concurrent GC that works in the background and minimizes pauses. One of it’s cooler features is string de-duplication which reduces the overhead of strings in RAM. You can activate that feature using -XX:+UseStringDeduplication.
Bir diğer açıklama şöyle. Yani G1 GC daha fazla işlemci kullanıyor. Dolayısıyla G1 GC çok işlemcili ve yüksek miktarda belleğe sahip bilgisayarlar için tasarlanmış ve concurrent olarak çalışıyor.
Since Java 9, the G1 collector has been the default GC, the main idea being to slice up GC pauses according to user-supplied time targets. It usually offers shorter pause times but at the expense of lesser throughput. In addition, the pause time increases with the size of the heap.
Java 8 İle Geliyor, Java 9 ile Default Oldu
G1 kelimesi Garbage-First anlamına gelir. G1 Garbage Collector' ın bundan önceki Serial, Parallel ve CMS (Concurrent Mark And Sweep) garbage collector'lardan daha iyi olduğu söyleniyor. Sebebi ise daha tahmin edilebilir duraklama/gecikme (predictable latency) süresi. Açıklaması şöyle. Yani örneğin en fazla 10 ms Garbage Collection süresi istiyorsak bu süreyi tutturma olasılığımız diğer GC yöntemlerine göre daha yüksek bir ihtimal.
The improvement over the CMS collector is called the G1 collector. Instead of having specific young and old generations for Heap this collector uses its entire heap and divides it into multiple regions. It has more footprint and the advantage of this collector is it has the most predictable latency and this is the best feature of this collector. When we start our application, we can pass on this variable that the maximum pause time (maxTargetPauseTime) that our application can withstand say 10ms for example. The G1 collector will try to ensure that the Garbage collection is done only for 10 ms and even if there is some garbage left it will take care in the next cycle. If we want the predictable latencies and pause times the G1 collector will be the best collector to use. This is the most commonly used collector for all the performance testing needs.
Java 10 ile İyileştirme - Parallel Full GC for G1 (JEP 307)
Another interesting feature which improves G1 worst-case latencies by making the full GC parallel.
If you remember, In Java 9 release, G1 was made the default GC for JVM, which was designed to avoid full GC, but when the concurrent collections couldn’t reclaim memory quick enough it would end up falling back on a full GC, and that creates a problem.
This change will parallelize the full GC algorithm so that in the unlikely event of a G1 Full GC, same number of threads can be used as in the concurrent collections to improve the overall performance.
Bir başka açıklama şöyle
Till Java 10, G1 garbage collector was being used as primary concurrent garbage collector. Java 10 offered parallel full GC for garbage-first (G1) GCs, improving its worst-case latency. It also improved source code isolation of multiple GCs for the GC code in HotSpot, introducing the GC interface. But, all these changes didn’t resolve the most important issues like long GC pauses with Garbage collector in Java.
Ancak
Her iki iyileştirme de stop-the-world durumunda istenilen şeyi tam olarak sağlamadı. Bu yüzden Java 11 ile ZGC geldi.
Region Nedir?
Açıklaması şöyle
By design, the G1 garbage collector manages the heap by dividing it into a fixed number of same-size regions. By default, the maximum number of regions is 2048, and region size corresponds to the maximum heap size as follows: heap size < 4GB: 2MB, <8GB: 4MB, <16GB: 8MB, and so on. Normally objects are allocated into a given region until it's full, and then at some point, the GC frees up the entire region by evacuating all live objects from it.
Şeklen şöyle

Region dizilimi de şeklen şöyledir. Burada Eden + Survivor alanları Young Generation olarak bilinir. Old Generation mavi renkte. Humongous nesneler Free Space olarak tanımlanan gri renkli alanlara yerleşirler.
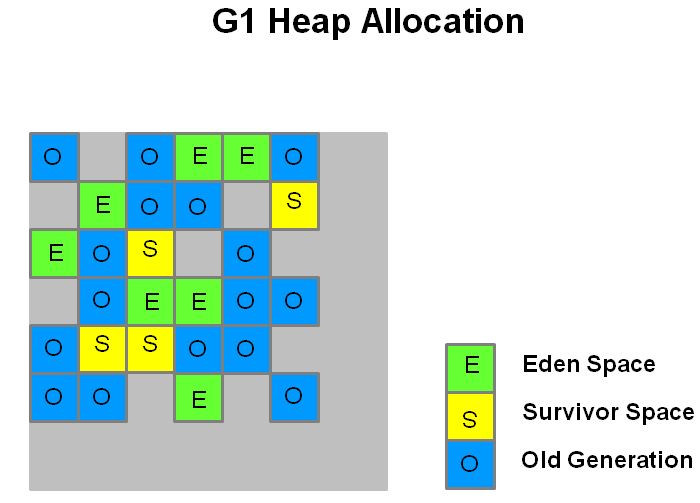
Burada önemli olan şey gri renkteki Free Space alanların gerektiğinde Eden veya Survivor veya Old Generation veya Humongous alan olarak kullanılabilmesi. Ayrıca aynı tipteki region'ların ardışık/yan yana olması gerekmiyor. Açıklaması şöyle
The heap is partitioned into a set of equal-sized heap regions, each a contiguous range of virtual memory. Certain region sets are assigned the same roles (eden, survivor, old) as in the older collectors, but there is not a fixed size for them. This provides greater flexibility in memory usage.
Eskiden bu alanların büyüklüğü sabitti. Şeklen şöyleydi.

Humongous Object Nedir
Açıklaması şöyle. Region büyüklüğünün yarısına eşit veya daha büyük nesne Humongous nesne kabul edilir.
All these changes, however, if an object (typically an array) is bigger than half the region size. Such objects are called Humongous in G1 terminology, and are handled as follows:1. A humongous object is allocated directly in the Old Generation (note that this may or may not the case in JDK 11 and newer).2. A separate humongous region is created for each such object by concatenating several contiguous regions. Some of these regions may need to be GCed first.3. Each humongous region can accommodate only one Humongous object and nothing else. That is, the space between the end of the humongous object and the end of the humongous region (which in the worst case can be close to half the normal region size) is unused (this is true at least in JDK 8-11, but may be addressed in latest JDK versions)
Humongous Object Neden Zararlı?
1. Humongous Object yerleştiği Region'ın geri kalanının kullanılmasını engelliyor. Bu yüzden heap içinde parçalanmaya sebep oluyor. Açıklaması şöyle.
ÖrnekIf the regions contain humongous objects, space between the last humongous object in the region and the end of the region will be unused. For example, our 550KB object prevents any other objects from being stored in the 1MB region, meaning 450KB remains unused. When we have lots of these objects, it results in a great deal of unused space and creates fragmentation.
Açıklaması şöyle
If allocated in the Old Gen, they cannot be GCed quickly even if they are short-lived (the Old Gen is collected less frequently than the Young Gen, and it takes more time)Creating a humongous region out of several normal regions may need a non-trivial amount of timeIf there are many humongous objects on the heap, it can lead to heap fragmentation because of unused "gaps" in humongous regions.
2. Eski bir JVM kullanıyorsak ve sürekli Humongous nesne yaratırsak bir zaman sonra Free Space biter ve mecburen Full GC yapmak zorunda kalırız. Bir başka açıklama şöyle.
Until Java 1.8u40, the releasing of humongous regions was only done during full GC events.
Humongous nesneden dolayı sürekli Full GC yapılmasını açıklayan bir yaz burada. Daha sonra bu durum düzeltildi. Açıklaması şöyle
Seçenekler üç başlık altında toplanabilir.
- GC logging options - G1 Garbage Collector - Loglama Seçenekleri yazısına taşıdım
- JVM sizing options - Seçenekler burada.
- G1C options - G1 Garbage Collector Seçenekleri yazısına taşıdım.
Seçenek Sayısı
Tablo şöyle. GC CMS'e göre daha az seçenek kullanıyor yani daha basit
Çıktı olarak şunu alırız.
We have Java less than Oracle JDK 8u45 version. For Java greater than this, it is written in the release notes that these humongous objects also get collected in minor events.
Search for: “G1 now collects unreachable Humongous objects during young collections” in the Release Notes
G1 Seçenekleri
G1 için tüm seçenekler burada.Seçenekler üç başlık altında toplanabilir.
- GC logging options - G1 Garbage Collector - Loglama Seçenekleri yazısına taşıdım
- JVM sizing options - Seçenekler burada.
- G1C options - G1 Garbage Collector Seçenekleri yazısına taşıdım.
Seçenek Sayısı
Tablo şöyle. GC CMS'e göre daha az seçenek kullanıyor yani daha basit
GC Algorithm JVM arguments(approximately)Common to all 50Parallel 6CMS 72G1 26ZGC 8
Açıklaması şöyle.
One of the main design points for G1 was to simplify the tuning required to realize good performance. For instance, the major inputs into G1 are the initial and maximum Java heap size it can use, and a maximum GC pause time you are willing to tolerate. From there G1 will attempt to adaptively adjust to meet those inputs while it executes your application.
G1 Kullanıldığını Teyit Etmek
Şöyle yaparız.
Şöyle yaparız.
java -XX:+PrintFlagsFinal -version |grep -E "MAX|UseSerialGC|UseG1GC|MaxHeapSize)"
size_t MaxHeapSize = 268435456 {product} {ergonomic}XX:+UseG1GC seçeneği
bool UseG1GC = true {product} {default}
bool UseSerialGC = false {product} {ergonomic}
Use the Garbage First (G1) CollectorEskiden olduğu gibi +UseXXXGC şeklindeki kullanım devam ediyor. Şöyle yaparız.
-XX:+AlwaysPreTouch-XX:CICompilerCount=15-XX:ConcGCThreads=6-XX:G1HeapRegionSize=16777216-XX:GCLogFileSize=10485760-XX:+HeapDumpOnOutOfMemoryError-XX:InitialHeapSize=48318382080-XX:MarkStackSize=4194304-XX:MaxHeapSize=48318382080-XX:MaxNewSize=28991029248-XX:MinHeapDeltaBytes=16777216-XX:NumberOfGCLogFiles=5-XX:-OmitStackTraceInFastThrow-XX:OnOutOfMemoryError=/bin/kill -9 %p-XX:+PrintGC -XX:+PrintGCApplicationStoppedTime-XX:+PrintGCDateStamps-XX:+PrintGCDetails-XX:+PrintGCTimeStamps-XX:+PrintTenuringDistribution-XX:+UseG1GC <------------------------------------Burası-XX:+UseGCLogFileRotation
Young GC Safhası
Bu safhada "Stop the World" yaklaşımı ile her şey durdurulur. MaxGCPauseMillis değeri dikkate alınarak şu iş yapılır. Bu işleri yapmak için çok sayıda thread kullanılır.
1. Hayatta kalan nesneler Survivor alanına taşınır.
2. Yaşlılık kriterini geçen bazı nesneler ise Old Generation alanına taşınır.
Old GC Safhası
Bu safha daha fazla adımdan oluşuyor. Tüm adımlar burada. Bu safhada da "Stop the World" yaklaşımı ile her şey durdurulur.
Bu safhada "Stop the World" yaklaşımı ile her şey durdurulur. MaxGCPauseMillis değeri dikkate alınarak şu iş yapılır. Bu işleri yapmak için çok sayıda thread kullanılır.
1. Hayatta kalan nesneler Survivor alanına taşınır.
2. Yaşlılık kriterini geçen bazı nesneler ise Old Generation alanına taşınır.
Old GC Safhası
Bu safha daha fazla adımdan oluşuyor. Tüm adımlar burada. Bu safhada da "Stop the World" yaklaşımı ile her şey durdurulur.
