Giriş
Kurulum
Açıklaması şöyle
First, you need to download the JMeter from the Apache JMeter website. Once after you download the zip file then extract it to a location where you want to work with it. Then move to the /bin folder inside that extracted folder and hit the following command- jmeter.sh to open the Apache JMeter with GUI, ...
Test Plan
Açıklaması şöyle
Before writing a test plan let’s see what it is, A Test Plan can be viewed as a container for running tests. It defines what to test and how to go about it. A proper test plan will have some of the elements such as;
- Thread groups
- Logic controllers
- Timers
- Pre and Post Processors
- Configuration Elements etc.
Please note that, In a test plan, it is a must to have at least one thread group.
You can simply add or remove above elements to a Test Plan by right-clicking on the name of the Test Plan (i.e in my case it is the Test Plan as shown below) and then select add from the menu and, chose whatever the element you want to add.
Örnek - İki Farklı Test Plan
Şöyle yaparız
I will perform two different runs for each technology, using Apache JMeter.The first run (from now on easy mode) is structured as follows:
- consider an initial chunk of 50 users connected to the echo server.
- keep increasing the connections in chunks of 200. Stop increasing at the maximum overload state, with 2000 concurrent users.
- keep the system in the maximum overload state for 3 minutes.
- start dropping out connections in chunks of 400 until 0. If any communication error happen, the existing connection gets closed. If any communication errors happen, the existing connection will be closed, kicking out the user from the echo server.
The second run (from now on hard mode) has the following structure:
- in a time range of 30 seconds, increase the number of active connections from 0 up to 12000
- keep the system in the maximum overload state for 1000 seconds.
- drop all the existing connections.
Thread Group
JMeter Thread Group yazısına taşıdım
Http Request ya da Samplers
Thread Group altına eklenir. Şeklen şöyle.
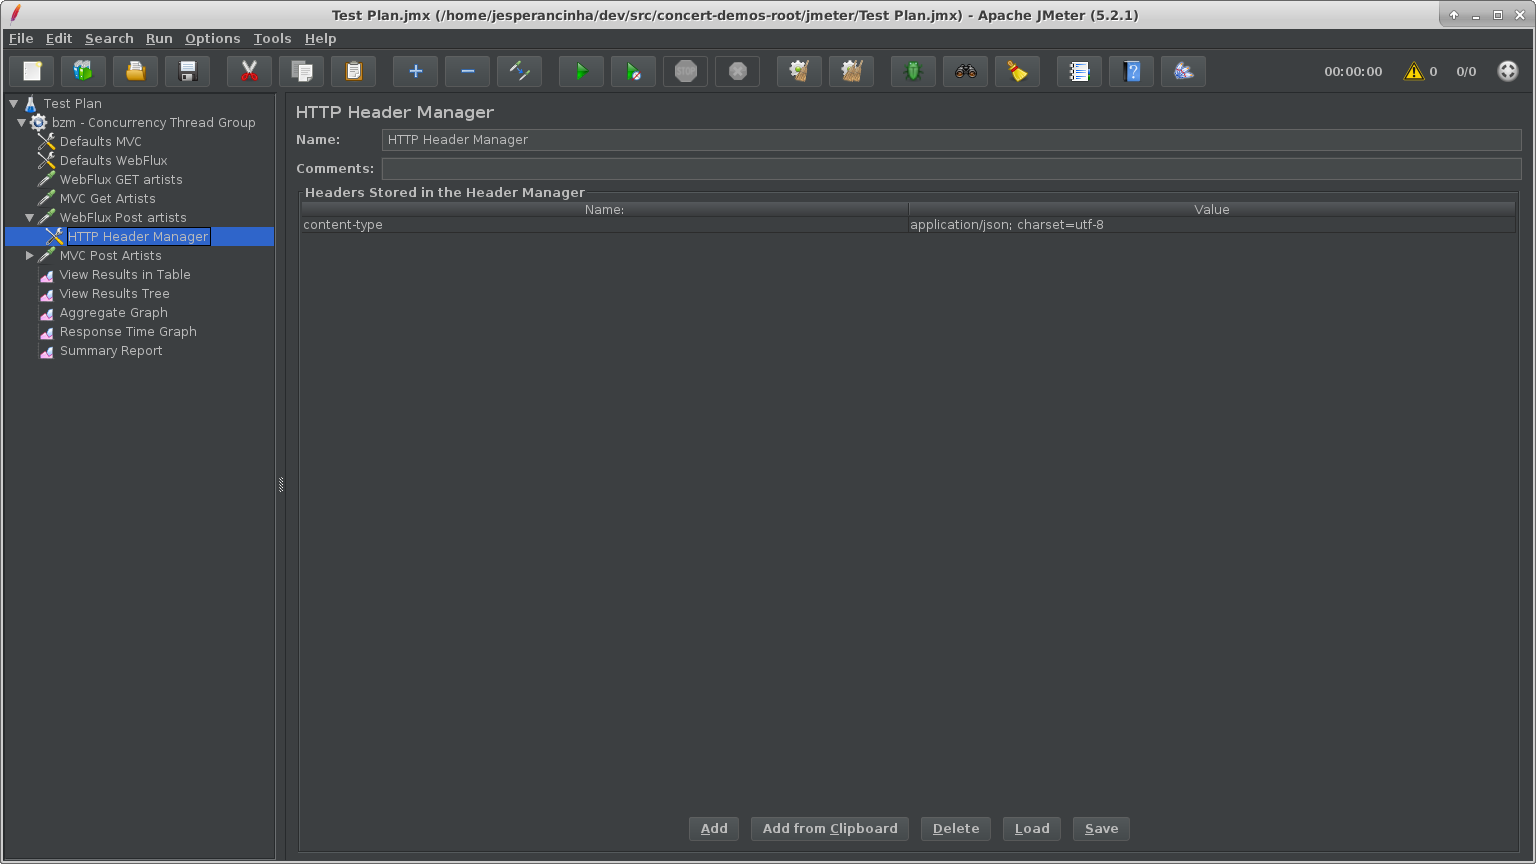
Her sampler için HTTP Header eklenir. Şeklen şöyle.
Listener
Http Request altında eklenir. Açıklaması şöyle. View Results in Tree sonuçları ekranda gösterir.
In JMeter, listeners are used for outputting the results of a load test. There are several types of listeners available in JMeter but for this test we will use View Results in Tree listener, which is a more simple one.
To add a View Results in Tree element to the Thread Group element right-click on the Thread Group element and select the menu items as shown in the picture as we did before.
Listener İle Gösterilen Sonuçlar
Açıklaması şöyle. Her bir Test Result'a tıklanarak sonuçlar görülebilir. Understanding the Result başlığına bakabilirsiniz.
Latency için açıklama şöyle
Latency: The number of milliseconds that elapsed between when JMeter sent the request and when an initial response was received
Response Time Graph Settings sekmesi şeklen şöyle.
Response Time Graph Graph sekmesi şeklen şöyle.
Diğer İşlevler
Açıklaması şöyle
Jmeter Features Explored:GET Request Validation: Submitting GET based HTTP requests to web server and then asserting response by utilizing: ResponseAssertion and JSONAssertionPOST Request Validation: Submitting POST based HTTP requests to web server by utilizing BeanShell PreProcessor to send random IDs in payload and then asserting response by utilizing: ResponseAssertion and JSONAssertionDatabase Query Validation: Initiating Database connections to fire SQL Queries to Mysql server and then asserting response using Bean Shell post-processor and ResponseAssertion.Custom Code Implementation: Writing a custom JAVA code to generate random images, utilizing that code to upload images to a Python based Flask server and then asserting response by utilizing: ResponseAssertion and JSONAssertionResult Views: Exploring ViewResults, SummaryReport and GraphResults Listeners to monitor run resultsNon-GUI Mode: Running Jmeter in non-GUI mode and validating resultsLoad Test: Load testing your application
Alternatif Olarak Apache Benchmark
JMeter yerine Apache Benchmark kullanılabilir.
CLI
JMeter CLI yazısına taşıdım
JMeter ile Http Yük Testi
Setup # of Threads, Loop Counts and always run load test in Non-GUI Mode!
Bir örnek burada. Kaç tane thread istediğimizi belirtebiliriz.
Test Result Comparison
Bir yazı burada
Recording
Test Plan > Add > Non-Test Elements > HTTP(S) Test Script Recorder yolunu izleyerek bir recoder eklenir. Bir yazı burada.


Hiç yorum yok:
Yorum Gönder